


Data Visualization Career in India: Skills, Jobs, Salary & Future Scope
Last updated on Mar 14, 2026


In today’s digital economy, companies generate massive amounts of data every day. To make sense of this data, organizations need professionals who can analyze information and present it visually through dashboards, charts, and reports. This is where Data Visualization becomes one of the most valuable skills in the modern data industry. A Data Visualization career in India is growing rapidly as businesses rely on data-driven decision-making.
This field combines data analytics, business intelligence, and visual storytelling to transform raw data into clear insights that help companies take better strategic decisions.
What is Data Visualization?
Data Visualization is the process of converting complex data
into visual formats such as charts, graphs, dashboards, and interactive
reports. Instead of reading long spreadsheets, decision-makers can quickly
understand trends, patterns, and insights through visual dashboards.
Popular tools used in Data Visualization include:
- Microsoft
Excel
- Power
BI
- Tableau
- Google
Data Studio
- Python
Visualization Libraries
These tools help analysts create interactive dashboards and business intelligence reports.
Why Data Visualization is Important in India
India is rapidly becoming a global hub for data analytics
and business intelligence. Companies across industries generate large
datasets that need to be analyzed and visualized.
Data Visualization helps organizations:
- Understand
business performance through dashboards
- Identify
market trends and customer behavior
- Track
KPIs and financial performance
- Improve
decision-making using data insights
- Present
complex analytics in a simple visual format
Because of this demand, professionals with data
visualization and dashboard design skills are highly valued.
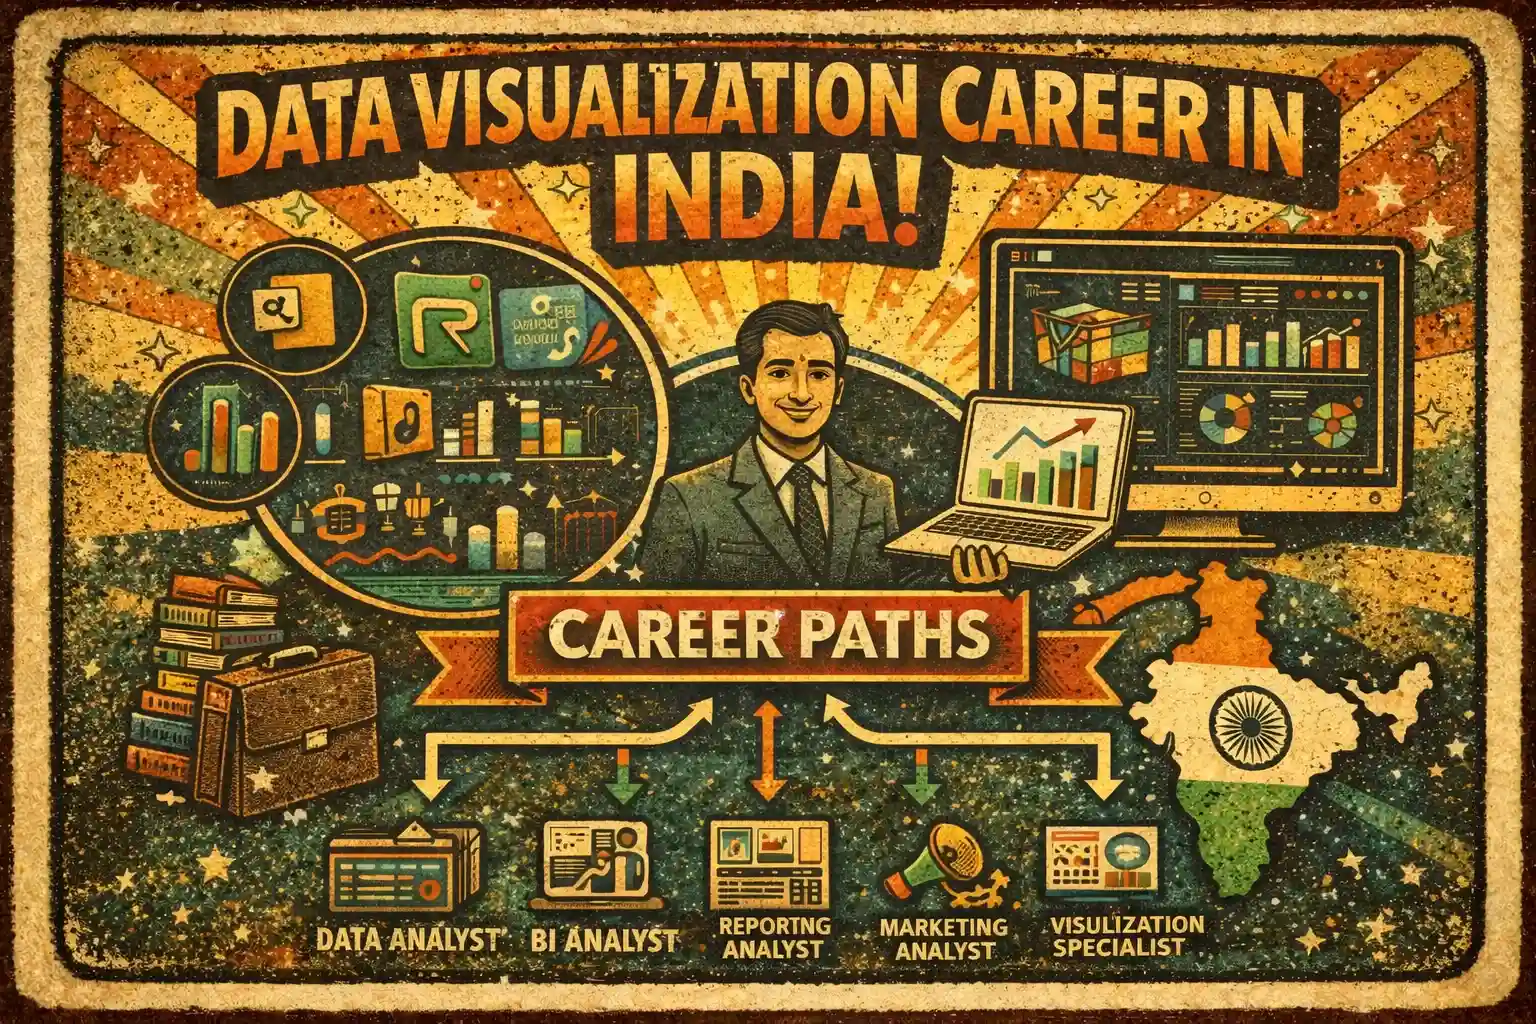
Top Data Visualization Career Opportunities in India
A Data Visualization course can open multiple career paths
in analytics and business intelligence.
Data Analyst
Data Analysts collect, clean, and analyze data to generate
insights. They create charts, reports, and dashboards to help businesses
understand performance.
Business Intelligence Analyst
BI Analysts focus on business data and build dashboards
using tools like Power BI and Tableau to monitor company performance.
Reporting Analyst
Reporting Analysts design reports and dashboards for
departments like finance, sales, and marketing.
Marketing Data Analyst
Marketing analysts visualize campaign performance, customer
behavior, and conversion metrics.
Data Visualization Specialist
These professionals focus specifically on designing interactive dashboards and data storytelling visuals.
Skills Required for a Data Visualization Career
To succeed in this field, professionals need a combination
of technical and analytical skills.
Important skills include:
- Data
analysis and interpretation
- Dashboard
design and data storytelling
- Microsoft
Excel for analytics
- Power
BI dashboard creation
- Tableau
visualization techniques
- Data
cleaning and preparation
- Understanding
KPIs and business metrics
Strong visual design and communication skills also
help in presenting insights effectively.
Salary of Data Visualization Professionals in India
The salary of Data Visualization professionals varies
depending on experience, skills, and company.
Average salary ranges:
- Entry-level
Data Analyst: ₹3 – ₹6 LPA
- Business
Intelligence Analyst: ₹5 – ₹10 LPA
- Senior
Data Visualization Specialist: ₹10 – ₹18 LPA
With experience and strong portfolio projects, professionals can earn even higher salaries in analytics roles.
Industries Hiring Data Visualization Experts
Data Visualization skills are required in almost every
industry that uses data.
Major industries include:
- IT
and Software Companies
- Digital
Marketing Agencies
- E-commerce
Platforms
- Banking
and Finance
- Consulting
Firms
- Healthcare
Analytics
- Retail
and Supply Chain
Companies like Amazon, Deloitte, Accenture, Infosys, TCS, and Flipkart regularly hire data analytics and visualization professionals.
Best Tools to Learn for Data Visualization
If you want to start a career in Data Visualization,
learning the right tools is essential.
The most widely used tools include:
- Microsoft
Excel for basic analytics and charts
- Power
BI for interactive dashboards
- Tableau
for advanced visualization
- Python
libraries like Matplotlib and Seaborn
- Google
Data Studio for online dashboards
Learning these tools helps you build professional dashboard projects for your portfolio.
How to Start a Data Visualization Career in India
Starting a career in Data Visualization involves learning
the tools, practicing with real datasets, and building projects.
Steps to begin:
- Learn
data visualization concepts and principles
- Master
tools like Excel, Power BI, and Tableau
- Work
on real-world datasets and dashboard projects
- Build
a strong portfolio of visualization work
- Apply
for roles like Data Analyst or BI Analyst
Professional training courses can help beginners learn these tools faster.
Future Scope of Data Visualization in India
The future of Data Visualization in India looks extremely
promising. As businesses continue adopting data-driven strategies, the
demand for professionals who can analyze and visualize data effectively
will continue to grow.
According to industry reports, Data Analytics and Business Intelligence roles will grow significantly in the coming years. Professionals who can combine analytics skills with visualization tools will have strong career opportunities.
Conclusion
A Data Visualization career in India offers exciting
opportunities in the fast-growing world of data analytics and business
intelligence. With the right skills in tools like Excel, Power BI, and
Tableau, professionals can build interactive dashboards and communicate
insights that help organizations make smarter decisions.
As businesses continue to rely on data, professionals who
can turn numbers into meaningful visual stories will remain in high
demand across industries.
Recently Added Articles


 Please select course category