





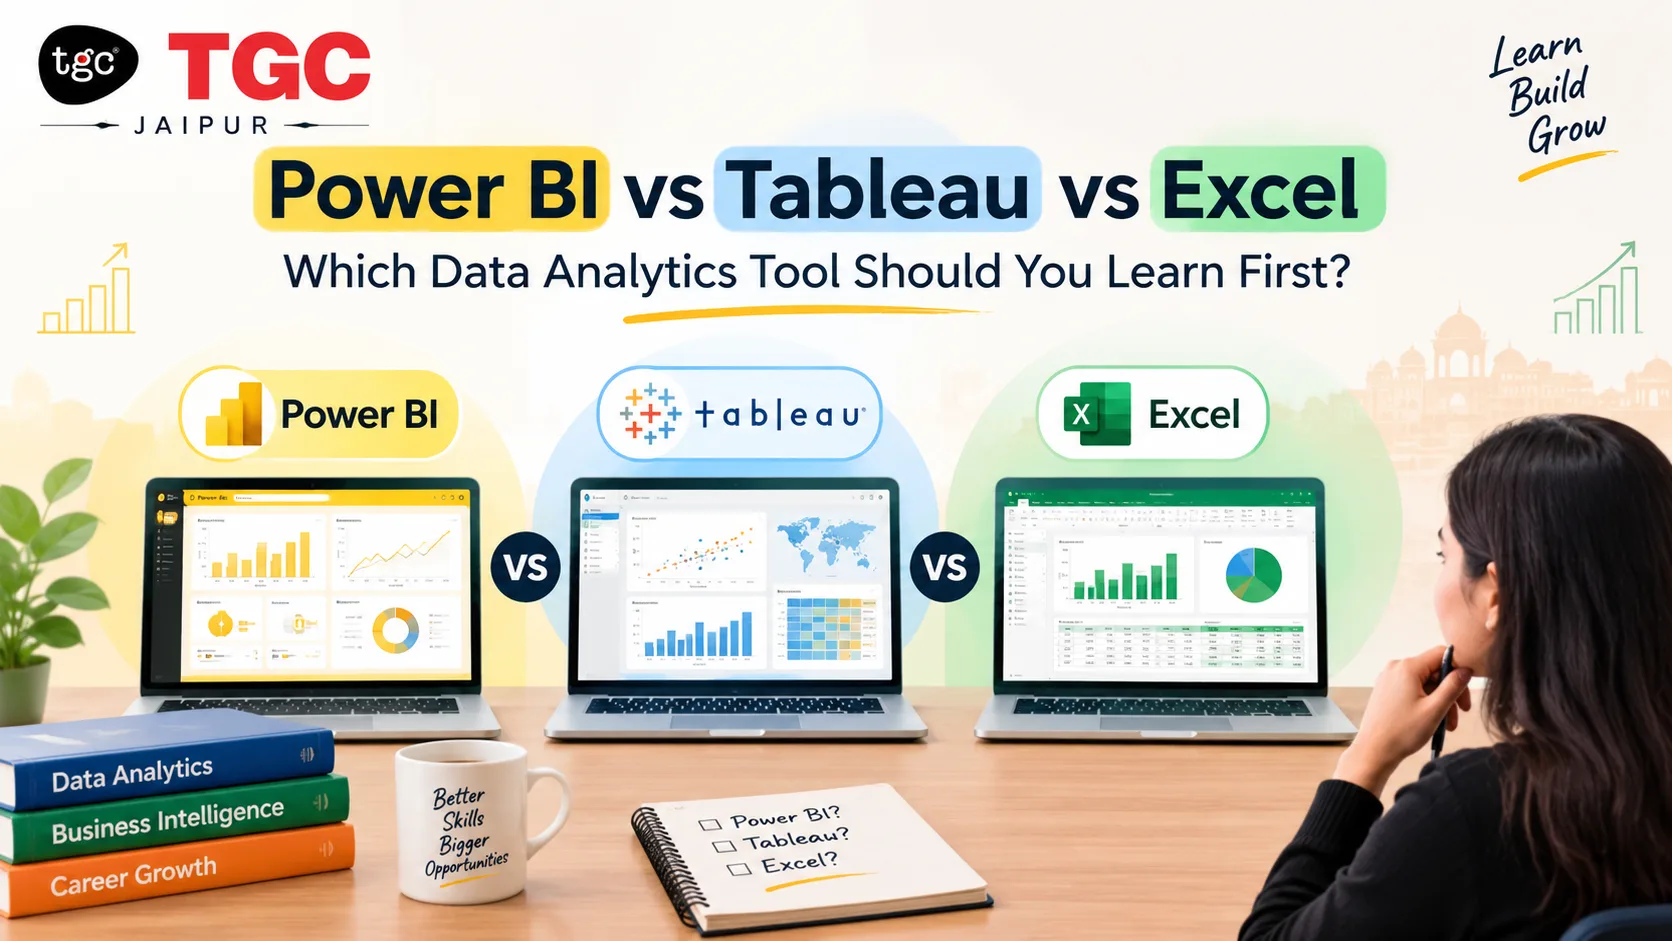
Power BI vs Tableau vs Excel: Which Data Analytics Tool Should You Learn First?
Last updated on Sep 22, 2026


Introduction
If you're stepping into the world of data analytics, you've probably run into the same question every beginner faces: should I start with Excel, Power BI, or Tableau?
All three are among the most in-demand tools in the analytics job market — but they serve different purposes, and picking the right starting point can save you months of confusion. In this guide, we'll break down what each tool actually does, where it shines, and which one makes the most sense for someone starting a career in data analytics.
Why This Question Matters So Much
Data analytics isn't a single skill — it's a stack of skills. Employers today expect analysts to know how to clean data, visualize it, and tell a story with it. Excel, Power BI, and Tableau each play a role in that stack, but beginners often waste time jumping between tools without mastering the fundamentals of any one of them.
Understanding the strengths of each tool helps you build a learning path that actually leads to job-readiness — not just certificates.
Excel: The Foundation Every Analyst Needs
Excel is often underestimated, but it remains the backbone of business data work across nearly every industry.
Strengths:
- Universally used — nearly every company, regardless of size, relies on Excel for reporting
- Teaches core analytical thinking: formulas, pivot tables, VLOOKUP/XLOOKUP, conditional formatting, and basic data modeling
- Low barrier to entry — most learners already have some familiarity with it
- Excellent for quick, ad-hoc analysis without needing a full BI environment
Limitations:
- Struggles with very large datasets
- Visualizations are functional but not built for interactive dashboards
- Manual processes can be error-prone at scale
Best for: Absolute beginners who need to understand how data is structured, cleaned, and summarized before moving into specialized BI tools.
Power BI: Microsoft's Business Intelligence Powerhouse
Power BI has become one of the fastest-growing BI tools globally, largely because of its tight integration with the Microsoft ecosystem (Excel, Azure, SharePoint, Teams).
Strengths:
- Intuitive drag-and-drop interface, making it easier to pick up after Excel
- Powerful DAX (Data Analysis Expressions) language for advanced calculations
- Seamless integration with Excel spreadsheets and SQL databases
- Strong enterprise adoption — widely used in corporate reporting environments
- Frequent free updates and a large support community
Limitations:
- DAX has a learning curve for complex calculations
- Best performance is tied closely to the Microsoft ecosystem
Best for: Learners aiming for corporate analyst, business intelligence, or reporting roles — especially in companies already using Microsoft tools.
Tableau: The Gold Standard for Data Visualization
Tableau is widely regarded as the industry leader when it comes to building rich, interactive, and visually compelling dashboards.
Strengths:
- Best-in-class visualization capabilities — ideal for storytelling with data
- Handles large and complex datasets smoothly
- Highly favored in industries like consulting, finance, and marketing analytics
- Strong drag-and-drop functionality with minimal coding required
Limitations:
- Licensing costs are higher than Power BI
- Some advanced features require familiarity with calculated fields and table structures
- Slightly steeper learning curve for beginners compared to Power BI
Best for: Learners targeting roles that emphasize data visualization, storytelling, and presentation-heavy analytics — such as consulting or marketing analytics.
Power BI vs Tableau vs Excel: A Quick Comparison
| Factor | Excel | Power BI | Tableau |
|---|---|---|---|
| Ease of Learning | Easiest | Moderate | Moderate-Hard |
| Data Visualization | Basic | Strong | Best-in-class |
| Handling Large Data | Limited | Good | Excellent |
| Cost | Often free/bundled | Free/low-cost tiers | Higher cost |
| Industry Demand | Universal | High (esp. corporate) | High (esp. consulting) |
| Best For | Fundamentals | BI reporting roles | Visualization-heavy roles |
So, Which One Should You Learn First?
Here's the honest answer: start with Excel, then move to Power BI, and layer in Tableau once you're comfortable with BI concepts.
This sequence works because:
- Excel builds your data instincts. You learn how raw data behaves, how to clean it, and how to perform basic analysis — skills that transfer directly into any BI tool.
- Power BI is the natural next step. Its interface feels familiar to Excel users, and it introduces you to dashboarding, data modeling, and DAX — all while staying within a recognizable ecosystem.
- Tableau rounds out your visualization skills. Once you understand BI fundamentals, Tableau helps you create more polished, presentation-ready dashboards that stand out to employers.
If your target role is corporate/business analyst — prioritize Power BI.
If your target role leans toward consulting, marketing, or data storytelling — prioritize Tableau.
Either way, Excel remains non-negotiable as your starting point.
Build Your Data Analytics Career the Right Way
Learning these tools in isolation from YouTube tutorials only gets you so far. What actually gets you job-ready is structured, hands-on training with real datasets, mentorship, and project-based learning — the kind that helps you build a portfolio recruiters actually notice.
At TGC India, our Advanced Diploma in Data Analytics is designed exactly around this Excel → Power BI → Tableau progression, combined with Python and SQL, so you graduate with a complete, industry-ready skill set — not just isolated certificates.
If you'd rather go tool-by-tool, you can also explore our dedicated courses:
- Certification in Advanced Excel
- Power BI Course in Delhi
- Adv. Certification in Tableau
- Data Science Course in Delhi (for those who want to go beyond analytics into ML and AI)
Final Thoughts
There's no single "best" tool in the Power BI vs Tableau vs Excel debate — each one solves a different problem. The smartest approach isn't picking a winner; it's learning them in the right order, so each tool builds on the last. Start with Excel to build your foundation, move into Power BI for structured business reporting, and add Tableau when you're ready to make your dashboards genuinely stand out.
Ready to start your data analytics journey the structured way? Explore TGC India's Data Analytics courses and get hands-on with Excel, Power BI, Tableau, SQL, and Python — all in one industry-aligned program
Recently Added Articles


.webp)








 Book A Free Demo
  7568111008
 Apply Now


 Please select course category